IntroductionAn engine's horsepower and torque numbers are two things that are often talked about in automotive circles, but may be misunderstood. In this article, I will be looking at how those numbers affect a car's ability to accelerate. Carroll Shelby once said: "Horsepower sells cars, torque wins races." Let's see if that is actually true. Table of Contents
AssumptionsIn this article, some assumptions will be made, as seen below.
Obviously, none of these assumptions apply to real life, but they will make explanation of many concepts much simpler. Power will be measured in Horsepower. Power and Horsepower will be used interchangeably in this article. Torque will be measured in pound-feet, which will be abbreviated as lb-ft or just tq. TorqueTorque is a force that tends to cause a rotation. A force applied at a non-zero distance from an object's centre will tend to rotate the object. This is easily seen in real life. If a wrench is placed on a bolt and a force is applied to the end of the wrench, the bolt will turn. If the same pulling force was applied directly to the bolt, it would not turn because the force's direction passes through the object's centre. The amount of torque is determined by multiplying the magnitude of the force by the force's distance from centre. 
Diagram showing torque. Torque can be used to create a force at a distance, as seen below. On a car, this is how the wheel and tire apply force to the pavement. 
Torque can be used to create a force at a distance. WorkWork is not something that is brought up often when talking about cars. Work is defined as the transfer of energy from one system to another, such as a person pushing a cart. Mathematically, work is the product of force and distance, and has units such as foot-pounds or Newton-metres. The direction of force (or at least a component of it) must match the direction of motion for the force to be considered to have done work. Also, if there is no motion, no work has been done. 
Work is done on the object by applying a force along a distance. Difference Between Torque and WorkNote that the units for both torque and work are the product of force and distance, yet torque and work are two different things. Torque is a force that tends to cause a rotation, which means that it does not actually cause an object to move along a distance. Work is a measure of energy transfer between systems, which may or may not have been done by a force from torque. 
The difference between torque and work. On a rotating shaft, work is done by the force from torque. Torque is a force that tends to cause a rotation, and the shaft is rotating. The force is going round and round, and so is the shaft, so if the shaft was "unrolled", there would be a force traveling along a distance, which is work. 
On a rotating shaft, the torque is doing the work. PowerPower is the amount of work that can be done in a certain amount of time, or "the rate of work", or "the rate of energy transfer between systems". The formula for calculating power is shown below: 
Power is the product of force and distance over a period of time. The above equation can be rewritten in terms of force and speed, as seen below: 
Using the definition of speed, power can be expressed in terms of force and speed. Shaft PowerOn a rotating shaft, the force from torque is doing work. The rate of work is dependent upon the shaft's rotational speed. Therefore, the amount of power that a rotating shaft has is the product of its rotational speed and its torque. Using arbitrary units, the power formula for a rotating shaft is: 
Shaft power using arbitrary units. Units of Shaft PowerWhen using pound-feet as units of torque, revolutions per minute (RPM) for rotational speed, and horsepower for power, shaft power can be expressed with the following formula: 
Shaft power in horsepower. The above power formula is often misinterpreted as showing that power and torque are the same thing, or that they somehow trade hands with each other at 5252RPM. This mistake is from the fact that a graph of torque in pound-feet and power in horsepower versus engine RPM has crossing lines at 5252RPM. Torque and power play the same role whether an engine is revving below, at, or above 5252RPM. Many diesel engines, and even some gas engines, are not even capable of revving that high at all. 
5252RPM is not a significant point in a physical sense. It is merely the RPM at which a graph of torque in pound-feet and power in horsepower would cross when drawn on the same piece of paper. If different units were used, the curves would cross at a different point, yet the principles of operation would remain unchanged. The above statements can be proven by changing the units for power and torque. Australians often use kilowatts for units of power, and Newton-metres for torque. With that, the shaft power formula becomes: 
Shaft power in metric units. Using metric units, the unit conversion constant is 9549, not 5252 like it was when pound-feet and horsepower were being used. This means that a graph of power and torque versus revs using metric units would have crossing curves at 9549RPM instead of 5252RPM. Australian engines obey the exact same laws of physics as American engines. The only real distinction between the two is that Aussie engines are designed to run upside down. GearsGears are used to change the torque and rotational speed of a part of a system of rotating shafts, or to change the direction of the transmitted motion. An example of the former would be the car's transmission, while an example of the latter would be the rear axle gears. An ideal (lossless) gear set transmits an equal amount of power to the output shaft as it received from the input shaft. This means that if a gearbox has a 2:1 gear ratio, the output shaft will be rotating half as fast as the input shaft, but will have double the torque. Below is a drawing that shows the effects of a gear set, using an abitrary ratio, GR. 
The gearbox is given a certain amount of power, in the form of torque and revs. It then puts out an equal amount of power, with the revs and torque adjusted according to the gear ratio. 
Formulae used for gears. It is interesting to point out that gears and electrical transformers are very similar. Gears change the torque and speed, while transformers change voltage and current. Both gears and transformers put out as much power as they receive. A car battery produces 12 volts and a lot of current, but a spark plug needs up to 50,000 volts and very little current. An ignition coil, which is a transformer, trades away the excess current from the battery to make the high voltage needed for the spark plugs. Drivetrain GearingA car's drivetrain uses multiple sets of gears to control how much of the engine's total power is going to torque, and how much is going to the rotational speed of the wheels. All gasoline piston engines produce too little torque and too many revs to properly turn the wheels of a typical road car. With 27 inch tires, 6000RPM at the wheels would be 450mph. It also takes a lot more than a few hundred pounds of force to even move something as heavy as a passenger car. This is why all cars have drivetrains which are setup to divide the revs and multiply the torque. Most cars are fitted with two sets of gearing between the engine and the wheels. The first set is the transmission, which multiplies the torque a certain amount, depending on what gear it is in. Typically, first gear has a ratio near 3:1, while the top gear has a ratio near 0.8:1. After the transmission, there is another set of gears which usually have a ratio of around 2.5:1 through 6.0:1, depending on the vehicle. Below is a diagram of a typical drivetrain found in most cars. 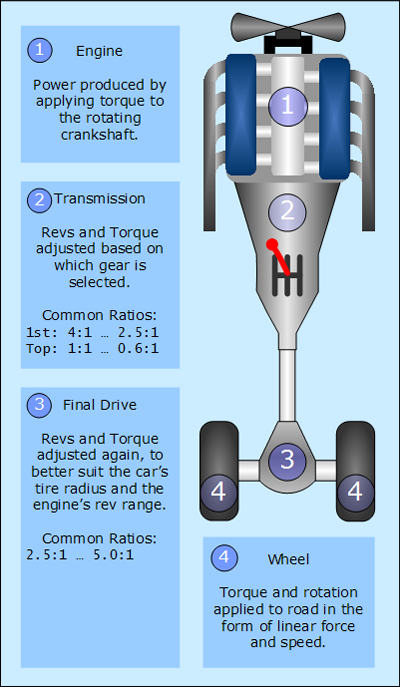
The drivetrain of a car is fitted with a transmission and final drive gearing to adjust the engine's torque and revs to accelerate the car. 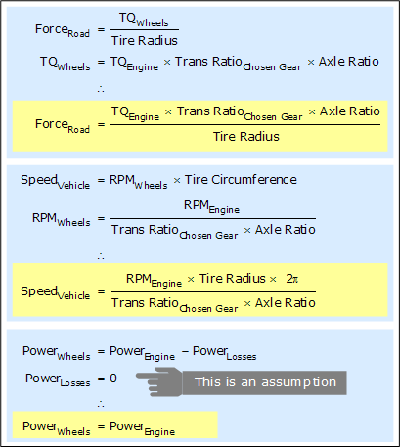
The wheel torque and revs vary with the engine torque and revs, and the gear ratios in between. The reason that cars have transmissions with multiple gears is so that the engine can be kept within its operating rev range while the vehicle accelerates from rest to possibly over 200mph. In first gear, there is plenty of acceleration because of the torque multiplication, but very little speed before the engine revs to its redline. In second gear, there is slightly less acceleration, but a slightly higher speed before hitting the redline. This trend of higher speed and lower acceleration continues through each gear in the transmission. 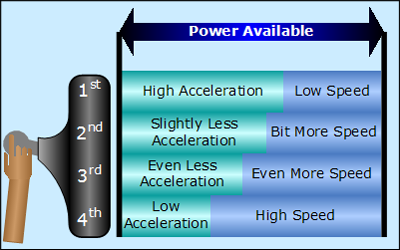
Each transmission gear provides a different amount of acceleration and speed. The combination of speed and acceleration is related to the power from the engine. Accelerating a CarNewton's second law of motion states that the acceleration of a body is related to the force being applied and the mass of the body, as seen below: 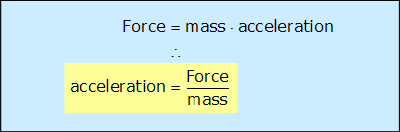
According to Newton's second law of motion, a greater force or a lower mass will result in a greater acceleration. In order for there to be any acceleration, the force must be applied at the same speed that the object is traveling, for a non-zero length of time. A force being applied at a certain speed for a period of time is power, therefore, the acceleration force on a moving object is determined by the power being applied at that speed. 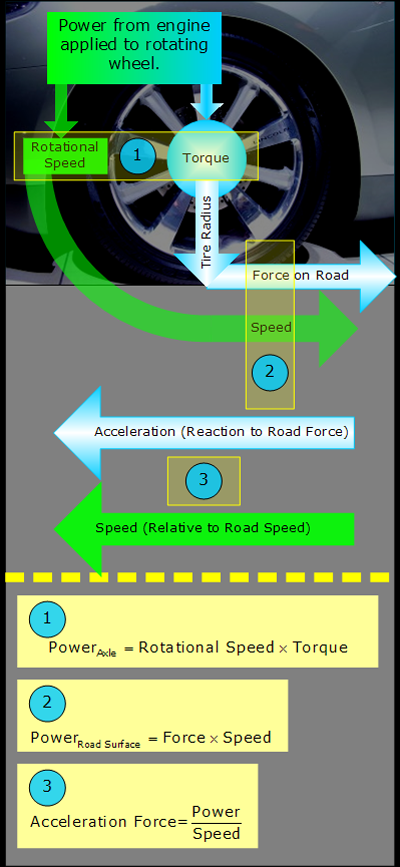
The wheels receive torque and rotational speed from the engine, and lay down a force onto the pavement. It is this force which accelerates the vehicle. The car's speed is directly related to the rotational speed of the wheel. 
The acceleration of a moving object is equal to the power divided by the speed and the mass. The product of speed and mass is known as momentum. The acceleration force that the tire puts to the road comes from the torque at the wheels. This is why the acceleration force is often calculated by passing the engine torque through the drivetrain gearing and wheels, as seen in the formula below. I will refer to this method of calculating the acceleration force as the torque method. 
The acceleration force can be calculated by passing the engine torque through the entire drivetrain and down the tire radius on to the road. If the vehicle's speed and the power of its engine are known at a given instant, the force of acceleration can be calculated without knowing anything about the drivetrain gearing, tire diameter, or even the engine torque. I will refer to this method of calculating the acceleration force as the power method. Below is the formula for the power method when using imperial units. 
When the power and speed are known, the acceleration force can be calculated directly without knowing anything about the drivetrain. The torque method and the power method will both produce the same results, as seen in the example below. 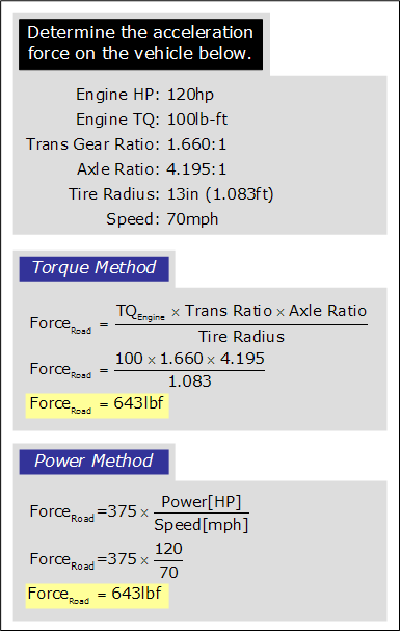
The calculated acceleration force is the same when using the torque method or the power method. A Simple ExampleTo demonstrate the effects of power and torque, I will put three different engines into the same car. The car's speed will be the same for each of the three tests, so that the differences in the acceleration force can be seen clearly. 
A sample car will be used for the comparison. The car has tires with a 24-inch diameter, which gives a radius of 1 foot. The tire will be turning at 500 RPM, which means the car is traveling at 35.7 mph. The transmission will be in a gear which has a gear ratio of 2 : 1. The final drive ratio will be chosen in a way that satisfies the driveshaft RPM and the wheel RPM. 
Details of the drivetrain layout. Blue Engine The blue engine is running at 2000 RPM and making 200 lb-ft of torque, which is 76 horsepower. The final drive ratio has to be 2 : 1 to match up with the wheel RPM and the driveshaft RPM. With this setup, the car puts 800 lbf to the road. 
The blue engine makes 76 hp, and puts down 800 lbf to the road. Green Engine The green engine is running at 4000 RPM and making 100 lb-ft of torque, which is also 76 horsepower. It is revving twice as high as the blue engine, but making only half the torque. The final drive ratio has to be 4 : 1 to match up with the wheel RPM and the driveshaft RPM. With this setup, the car puts 800 lbf to the road, which is the same as the force made by the blue engine. 
The green engine makes 76 hp and puts down 800 lbf to the road, just like the blue engine. Red Engine The red engine is running at 4000 RPM and making 200 lb-ft of torque, which is 152 horsepower. It is making just as much torque as the blue engine, and revving just as high as the green engine. The final drive ratio has to be 4 : 1 to match up with the wheel RPM and the driveshaft RPM. With this setup, the car puts 1600 lbf to the road, which is twice the force that the other two engines made. 
The red engine makes 152 horsepower, which is twice the power of the other two engines. It is putting a 1600 lb force to the road, which is also twice as high as the other two engines. It can be seen from the comparison of the above three engines that the most powerful one gave the highest force, and the two which made the same power as each other made the same force as each other as well. The two engines with the same power had a different amount of torque and revs, but the acceleration force was equalized by the final drive gear. This clearly shows that the engine's power, regardless of how much torque it is making or how high it is revving, determines the car's acceleration force. Power Curves and Power BandsEngine performance is often described by the peak power figure. A good engine will produce high peak power, and have a very high average power level as well. A graph of power with respect to engine RPM is known as a power curve, and holds important information about an engine's performance across its rev range. It is possible for one engine to have more average power than another, even with a lower peak power figure, as seen in the example below. 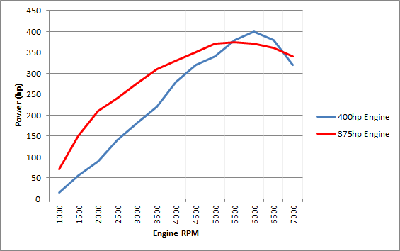
The power curves above are for one engine with 400hp, and another with 375hp. While the 400hp engine has a higher peak power figure, the 375hp engine has a much higher average power throughout the rev range. In most cases, especially on the street or in drag racing, the 375hp engine seen above would make for a faster car. The power band is the rev range where the engine is producing an arbitrary percentage of its peak power figure. For example, the 80% power band of an engine with 500hp would be the rev range where it makes 400hp or more. A wide power band implies high average power. This will be seen later in the article. An engine's power band can be predicted as wide or narrow based on certain characteristics. Some examples are shown in the table below.
An engine's power band can be predicted to be wide or narrow based on certain characteristics. There are many exceptions. Comparing Two CarsLet's compare two cars with two different engines that have the same peak power output, but different power bands. Both cars have the same curb weight, transmission, tire radius, and so on. In fact, the only difference between the two cars will be the engines. One car will be equipped with a 500hp V8, and the other will have a 500hp turbocharged 4 cylinder engine. The car with the V8 will be named Redneck , and the car with the 4 cylinder will be named Ricer . The V8 can rev to 6000RPM and produce a ton of torque, while 4 cylinder can to rev way up to 9000RPM and produce a fair bit of torque. To keep the math very simple, the V8 idles at 600RPM, and the I4 idles at 900RPM. Below are plots of the two fictitious engine's torque and power curves. 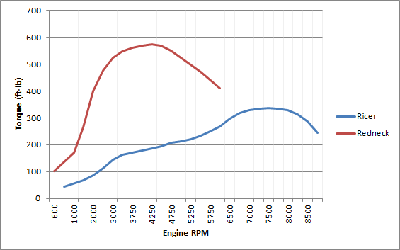
Figure 1: Torque versus RPM for Redneck and Ricer. These are unrealistic curves which have been exaggerated to help illustrate certain concepts. 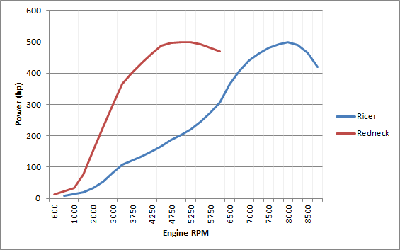
Figure 2: Horsepower versus RPM for Redneck and Ricer. This is calculated from the torque at each RPM. Both engines produce a peak of 500hp, as specified earlier. The V8 produces 500hp at 5000RPM, and 573tq at 4250RPM, while the I4 produces 500hp at 8000RPM, and 337tq at 7500RPM.
Since the V8 was revving low, it needed to produce a lot more torque than the I4 to reach 500hp. At the same time, the I4 needed to rev higher than the V8 to produce 500hp, because it offers up less torque. Below is a comparison of the two engines' power bands. 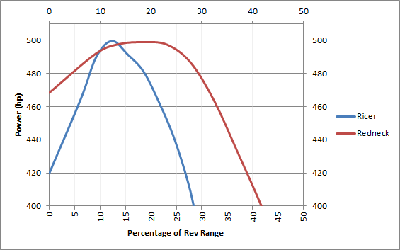
Figure 3: Power band comparison of both engines. Note that the Redneck's average power production (area under the curve) is higher, and that the peak power is the same, at 500hp. If the x-axis on the above graph seems unusual, there is a separate page on comparing power curves which explains why the rev ranges are not compared directly. Notice that while both engines have the same peak power figures, the Redneck's engine has a much wider 80% power band. This situation is a considerable advantage for the Redneck. Between the two cars, the one with the made-up V8 is going to be faster than the one with the made-up I4, because the V8 has a higher average power level throughout its rev range.
Both vehicles have a curb weight of 3000 lb, which gives both cars a peak power-to-weight ratio of 330 hp per ton. A final drive (axle) ratio of 3.55:1 has been chosen for the Redneck, and a 5.325:1 ratio has been chosen for the Ricer. The Ricer uses a higher ratio to match the high-revving engine.
With all of the above data, a velocity-versus time graph can be created for both cars. It is important to remember that aerodynamic drag, initial launch conditions, and other losses have been ignored for this comparison. Below is a graph of the Redneck and Ricer's acceleration data. 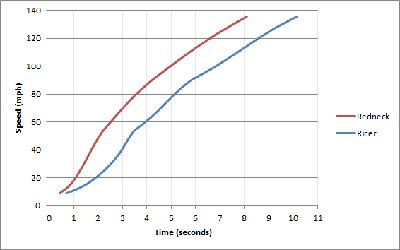
Figure 4: Velocity versus time for Redneck and Ricer. The slope of the curve represents acceleration. Low-Speed AccelerationThe results of the race between the Redneck and Ricer shows that the Redneck had a significant advantage from start to 60 mph. Above 60 mph, the Ricer was revving closer to its power band, and both cars had similar acceleration to the top speed of approximately 135 mph. In drag racing, the Ricer would have lost the race, but on a racetrack, the difference could be quite minor. Therefore, it can be said that a vehicle which is subject to widely varying speeds must have a very wide power band to be competitive, while a vehicle operating in a narrow range of speeds does not. Shift PointsWhen the Ricer and Redneck were racing, they were shifting gears at their engine's redlines. In many real-life cases, shifting gears earlier may be advantageous for acceleration. An engine with a power curve that begins to "fall off" at very high RPM should be shifted earlier, if doing so would bring the engine to an RPM where it is making more power. Gear shift points should always be chosen in such a way that the engine is putting out the highest average power to the wheels. In the race between the Ricer and Redneck, both cars were fitted with a three-speed, wide-ratio transmission. A high-revving engine with a narrow power band would benefit greatly from a transmission with closer ratios, and additional gears so that the engine can be revved much more closely to its power peak as the vehicle's speed changes. For a more detailed analysis of the effects of transmissions on vehicle performance, refer to the transmissions article. DriveabilityDriveability is a subjective term used to describe the ability to "access" an engine's power. A naturally-aspirated engine with a wide power band will have very good driveability; putting the pedal to the floor at any speed in any gear should yield reasonable acceleration. On the other hand, a car with a narrow power band would not be considered as "driveable". Passing cars while cruising on the highway often requires dropping a gear to bring the engine's revs up to access the power. This is one of the reasons that luxury cars often come with large, naturally-aspirated or supercharged engines, while small, turbocharged engines are not as common and often found in more "focused" sportscars where outstanding driveability is not expected or required. Engines are sometimes described as being "torquey". This is slang for having good driveability, a wide power band, or a lot of power at low RPM. Streetability is another term which is often used to describe engines with the aforementioned characteristics, along with good road manners, such as a smooth idle and the ability to start in very cold temperatures. High Torque Engines versus High Revving EnginesThe torque that an engine can produce is somewhat related to the displacement of the engine. Larger displacement engines are likely to be much bigger and heavier, making them unsuitable for certain types of vehicles. This is why many small race cars have engines with small displacement, high-revving, and sometimes equipped with forced induction to produce high horsepower. Also, race cars are often given limits on displacement, which means their only chance at producing a lot of power is to rev very high or use forced induction. A large engine may be able to produce power more reliably than a smaller one, but not necessarily. There are plenty of big, gutless engines that don't last. Heavy vehicles are almost always equipped with large displacement engines because they require more low-RPM power to accelerate from rest (and very low speeds). As the weight of a vehicle goes up, the ability to accelerate from rest becomes increasingly significant. ConclusionIn order to quickly accelerate a vehicle, the engine must be able to make a large force at the speed that the vehicle is traveling. The amount of power determines the force that the engine can create at a given speed, whether it is a very low speed or a very high speed. It does not matter if the engine makes power by revving high or making a lot of torque, because drivetrain gearing can be used to adjust the torque and revs proportionally. “ Peak power sells cars. High average power wins races. ” A vehicle's peak torque and power figures can only give a general idea of performance. The best way to make a good comparison between vehicles is to go racing! See Also |
|
|
|||||
|
|