IntroductionIn this article, I will be looking at how to compare the power curves of two engines that have different rev ranges. Table of ContentsExample ComparisonTo make a comparison, I have made two power curves that look exactly the same; they both have a rev range that is 2000RPM across. Do these engines have the same average power as each other? 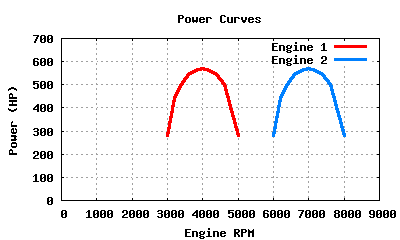
Figure 1: To compare the capabilities of the two engines, they need to be given the same work to do. Let's say we want to accelerate a rotating shaft from 1500RPM to 2500RPM. This would be about the same as accelerating a car from 110mph to 190mph if it had 27" diameter tires. In order to do the work, the engines both need to drive a gearbox, which will then drive the shaft. If Engine 1 is turning at 3000RPM when the shaft is at 1500RPM, then it needs a gearbox with a 2:1 ratio, as seen in these calculations:
             Input RPM (Engine)    3000RPM
Gear Ratio = ------------------ = --------- = 2:1
             Output RPM (Shaft)    1500RPM
Engine 2 is starting at 6000RPM, so it will need a 4:1 gearbox to turn the shaft at 1500RPM. Below is a graph showing the two engines at work. 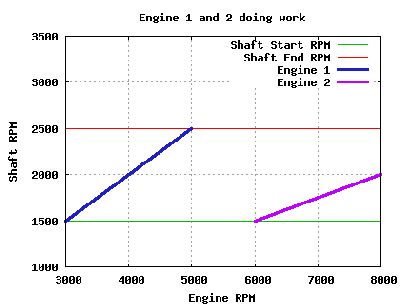
Figure 2: As seen in Figure 2, there is a problem with the setup. Engine 2 cannot rev the shaft from 1500RPM to 2500RPM with 4:1 gearing. Looking at the gear ratio formula again, it can be seen that Engine 2 would need to rev all the way up to 10000RPM to get the shaft to 2500RPM:
             Engine RPM
Gear Ratio = ----------
             Shaft  RPM

Engine RPM = Gear Ratio * Shaft RPM
           =    (4)     * (2500RPM)
           = 10000RPM
There is no gear ratio that could have been chosen to correct this situation; there is no way Engine 2 can rev from 6000RPM to 8000RPM while the output shaft revs from 1500RPM to 2500RPM. This can be proven by looking at the endpoints of the work, and the engine's rev range:
Beginning of Rev Range:

             Engine RPM   (6000RPM)
Gear Ratio = ---------- = --------- = 4:1
             Shaft  RPM   (1500RPM)

End of Rev Range:

             Engine RPM   (8000RPM)
Gear Ratio = ---------- = --------- = 3.2:1
             Shaft  RPM   (2500RPM)

4:1 vs 3.2:1...
No single gear ratio satisfies the situation.
Gearboxes act linearly, that is, if the input speed is doubled, the gearbox will exactly double the output speed, no matter what the ratio is. Also, if the gearbox is turned at 0RPM, the gearbox will turn the output shaft at 0RPM. Engine 2 can not obey these rules while doing the work we wanted. This means that the two engines do not have the same power as each other when called upon to do the same task. Engine 1 is the better engine. 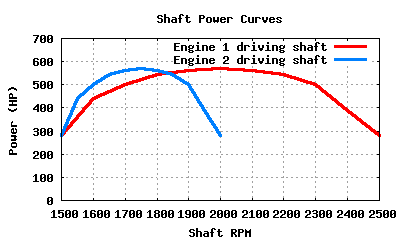
Figure 3: At this point, it may look like Engine 2 is not capable of accelerating the shaft from 1500RPM to 2500RPM at all. It is already known that there is no single gear ratio that will work, and that Engine 2 is not capable of revving up to 10000RPM. Changing the gear ratio "on the fly" can be done instead. This is the equivalent to shifting gears on a car, and is one of the reasons why cars have gearboxes with multiple gears. 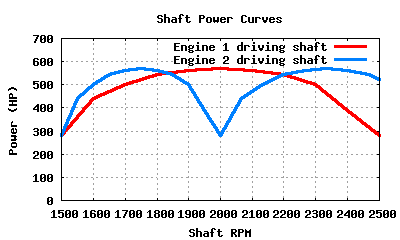
Figure 4: Mathematical Comparison of Power CurvesThe difference between the two engines can be compared mathematically. Engine 1 has an operating range of 3000RPM through 5000RPM, which means its upper rev limit is 1.67 times its lower rev limit, as seen below: 5000RPM ------- = 1.67x 3000RPM This means that the Engine 1 is turning 1.67x (67%) faster when it gets to its upper limit than when it started. Now, let's look at Engine 2: 8000RPM ------- = 1.33x 6000RPM Engine 2 only changes its revs by 1.33x (33%) as it passes from 6000RPM to 8000RPM. This means that Engine 1 has a wider rev range, even though they both have a rev change of 2000RPM. In general, the scale of the width of the rev ranges between two engines can be determined using the formula seen below. 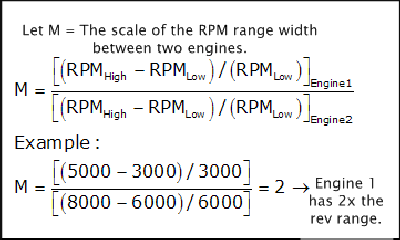
Figure 5:
In the case where 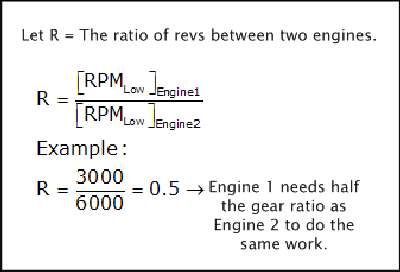
Figure 6:
In the case where ConclusionThe power curves of two engines are not comparable directly if their rev ranges differ. The rev ranges must be corrected to show the average power when doing the same work. |
|
|
|||||
|
|